New methods for cleaning validation in food manufacturing
A new case study provides new knowledge for food manufacturers on cleaning production equipment and ensuring a clean production start-up.
A quick and valid check of the effectiveness of the cleaning of closed production equipment in a food production operation is important to ensure that new production runs start in a clean state. What is the best way to do this?
The most commonly used methods of cleaning validation are sensors that measure the actual cleaning procedure. Depending on how sophisticated the CIP system is, these sensors may measure temperature, conductivity, pH, flow, and turbidity. These measurements indicate whether cleaning is performed uniformly well over time. What these measurements do not show is the formation of biofilms in production systems, and by extension, whether the chosen cleaning procedure is optimal for a production process in which (e.g.) production times are slightly longer than average. This article assesses the testing results for the new validation methods.
Validation of cleaning
Once a measurement method has been validated, it is then routinely applied, monitored, and verified. Thus, in order to perform monitoring and verification, the cleaning procedure and measurement methods must first be validated, and requirements for cleaning effectiveness must be set out in a risk assessment. Consequently, the process of finding appropriate sensors to measure cleaning effectiveness is considered a validation process. Verification is achieved only when the specific measurement method is consistently used by a food manufacturing business to monitor a specific cleaning procedure.
Direct or indirect sampling
Some manufacturers choose to take direct or indirect samples to verify the effectiveness of cleaning, while others choose to use CIP sensor measurements alone as evidence that proper cleaning has been performed. In the latter case, no evidence of cleaning efficacy is obtained, so the measurements do not show whether the production equipment is actually clean.
In the case of direct sampling, selected locations on or in the production equipment are swabbed. Care must be taken to swab the most hygiene-critical areas - the places that are most difficult to keep clean.
In the case of indirect sampling, water from the final rinse is used. Naturally, for the result to be reliable in this case, it must be representative of the portion of the production equipment cleaned in the process in question.
Therefore, it is important to assess the equipment's hygienic design such that there are no hygienically critical areas where, for example, the flow is not optimal. Non-optimal flow will lead to cleaning results that deviate from expectations, and rinse water samples will not reveal the actual cleaning effectiveness. In addition, it is important to remember the dilution factor when sampling final rinse water. In this context, choosing an analysis with a low limit of detection is key.
If the chosen analytical method always returns low values, or perhaps even "undetectable" values, it should be assessed whether the method is truly fit for this purpose, and whether the production line risk assessment is functioning as intended. It is important to note that an absence of contaminants is not necessarily due to effective cleaning, but potentially due instead to a risk assessment that is deficient in terms of sampling or analysis.
Management of biofilm and stressed microorganisms
Microorganisms from a biofilm that remain on or in equipment after cleaning may be in a state where they are viable, but not culturable. In other words, while they could grow in the product and lead to issues with food safety and product quality, they may be unable to grow and be enumerated using a standard test for either a particular microorganism or a particular analysis (e.g., total aerobic count). If microbiological cultivation and enumeration is desired, the challenge which both direct and indirect sampling pose is that the microorganisms are stressed, often leaving them unable to grow and become "countable" in a standard test. This problem can be addressed by "nursing" the microorganisms so that they are no longer stressed, allowing them to grow and be enumerated.
lternatively, a method can be chosen where microorganisms are counted without prior cultivation.
Chemical studies of final rinse water typically do not present the same challenges as microbiological counts, since chemical components that are measured instead of actual viable microorganisms.
The research project entitled "Hygiene Monitoring in Closed Production Equipment," co-financed by the Danish Agency for Innovation and Development, is working on different possibilities for hygiene monitoring in closed production equipment, such as tanks, pipes and pumps. In order to measure the hygiene of closed equipment, the project has chosen to examine final rinse water in an indirect sampling approach. The research project has tested and validated two new measurement methods and has also included commonly known microbiological validation tests so the new methods can be validated against known ones.
While the previous article (Plus Process no. 5) on this topic concentrated on the description of new methods for cleaning validation (TOC measurement and counting of microorganisms without prior cultivation), this article will deal with the first case study, where results are correlated to known analytical methods. At the time of writing, initial work on a control chart for the cleaning of a test object has begun, but it has yet to be completed.
Case study 1: results and assessment relative to application
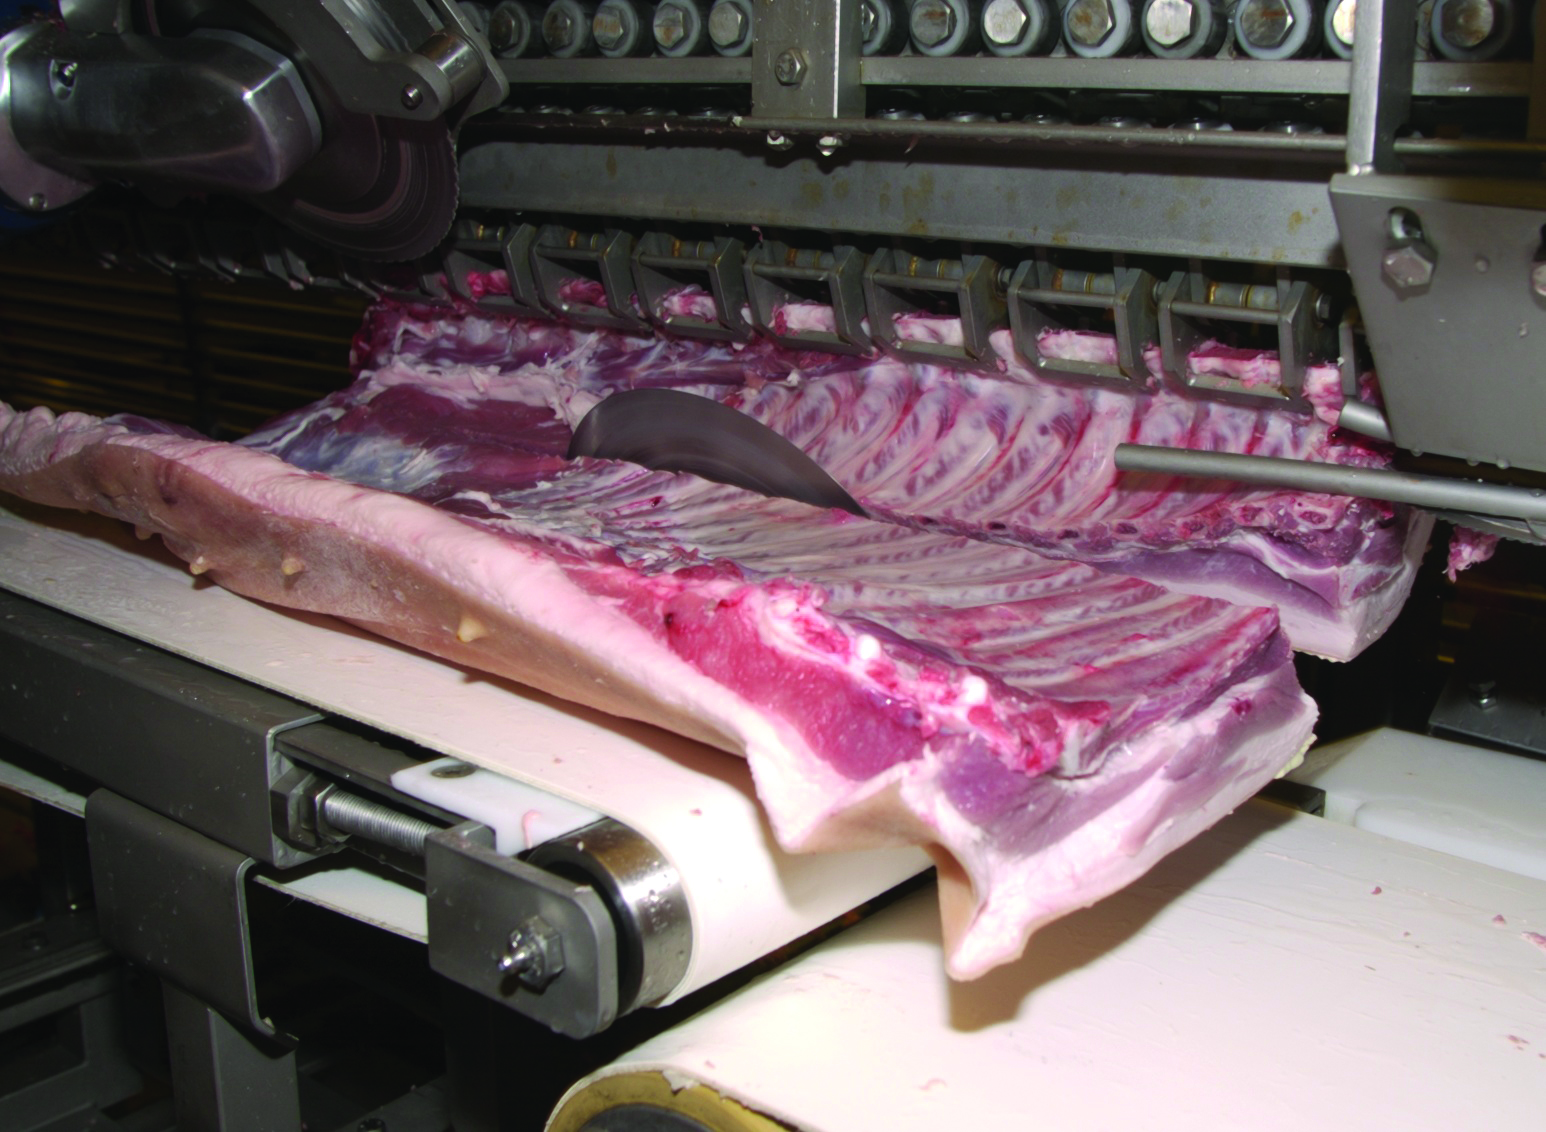
For the first case study, it was decided to sample a plate heat exchanger after intermediate cleaning ("IC") and after final cleaning ("final"). Additionally, a sample was taken from the clean water before it was used for rinsing ("control"). An intermediate cleaning ("IC") is a shorter cleaning consisting of rinsing, cleaning with alkaline detergent, and a final rinse; meanwhile, final cleaning ("final") takes somewhat longer, as it consists of rinsing, alkaline cleaning, rinsing, acidic cleaning, and one final rinse.
The final rinse water samples were subjected to common microbiological analyses (IBC and total anaerobic count), a bacterial count assay (BactoBox), a total organic carbon (TOC) assay, and conductivity and particle count assays. The IBC method is a flow cytometric microorganism measurement.
A principal component analysis (PCA) was performed on the data. PCA is a technique used to examine variance in data. It is often used to explain and visualise data. The variation in these variables is largest in the direction of PC1 (x axis) and smaller in the direction of PC2 (y axis). This also means that the distance between points along PC1's axis is more meaningful (more different) than the distance along PC2's axis. When a variable's vector points towards the left of the biplot, it means that regardless of whether it appears above or below the PC1 (x) axis, higher values of one variable will give rise to higher values of another variable in the same direction. The closer the variables are to each other in the plot, the stronger the correlation.
The results for total aerobic count / ml are very low for all samples (<10 or 10 cfu/ml). It is known that microorganisms from a biofilm can be stressed and in a state where they are viable, but not culturable. In this case, the total aerobic count analysis proved not to be the most appropriate analysis for validation of cleaning effectiveness. Because the resulting values were either low or below the limit of detection, this analysis was omitted from further statistical analysis. Certain outliers which were possibly the product of laboratory errors in one analysis were also eliminated from the data set.
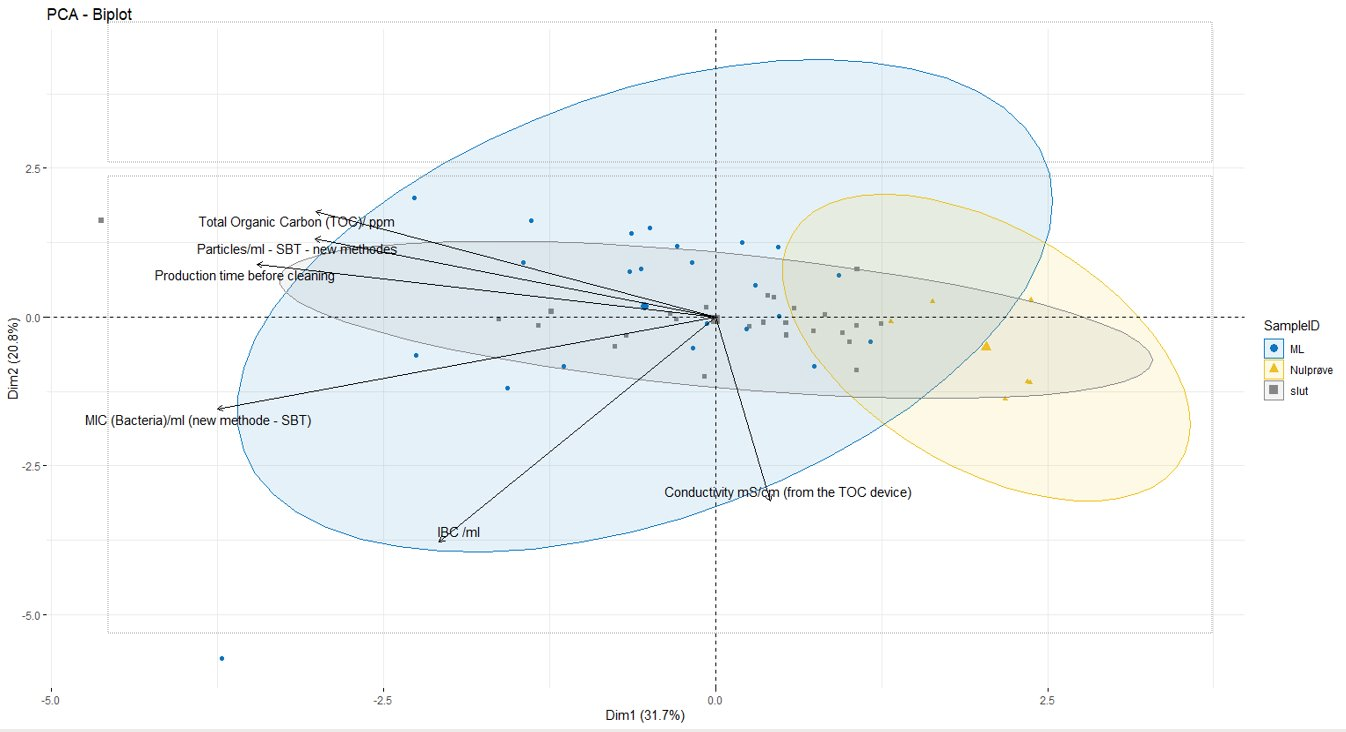
That said, Figure 1 shows that while the control samples are mostly clustered together (in the yellow circle), some of the control samples ended up in the "final" and "IC" groups instead. The nearby "final" and "IC" samples were taken from the shortest production runs, meaning that biofilm formation was minimal and the cleaning procedure eliminated it completely.
Looking at the "final" and "IC" samples more generally, these samples are difficult to distinguish from each other. The "IC" samples show greater dispersion. If we look at the individual results, we find that "IC" samples clustered with "final" samples were taken after shorter pre-cleaning production times.
Both "IC" and "final" samples with longer production runs had greater TOC and particle counts, so we can conclude that longer production runs result in higher values of these variables after cleaning. This very likely indicates that longer production times resulted in the formation of more biofilm, and the cleaning procedures used ("IC" and "final") were not sufficient to eliminate the biofilm completely.
Given the left-pointing vector for production time in the PCA biplot, there is also a correlation between longer production times and greater MIC (bacteria/ml; BactoBox). This is particularly the case for "IC" samples, which is to be expected, given that the intermediate cleaning is not as effective as the final cleaning.
It is also worth noting that there were no issues with food safety or product quality during the sample collection period. Thus, while remnants of TOC and microorganisms were detected in rinse water samples, the equipment was still clean enough for the production process in question. However, it is likely that shorter production times allowed for the plate heat exchanger to be cleaned more thoroughly, such that the residual biofilm from longer production runs was removed completely by cleaning after shorter production runs.
Conclusion and lessons from case study 1
The omission of the total aerobic count assay in the statistical analysis of the results from case study 1 supports an assumption we have had in recent years; namely, that microorganisms from a biofilm have difficulty growing in standard tests, so the total aerobic count assay is not the most suitable analysis to demonstrate that cleaning is sufficiently effective. The very small fluctuations that appear in total aerobic count assays make it difficult to draw conclusions from the results.
The results also show that longer production times result in more pronounced biofilm formation, and removing the film completely requires more optimal cleaning. The cleaning procedure for case study 1 was sufficient to avoid impacting food safety or product quality, but an effect can be seen in terms of production run length and greater values for TOC, particles, bacteria (MIC), and partly IBC. It is likely that in spite of the cleaning procedure not being quite sufficient for longer production runs, the shorter production runs in which biofilm formation was reduced allowed the cleaning procedure to eliminate remnants from the equipment. The cleaning procedure was able to thoroughly clean the equipment after shorter production runs.
Although the first case study focused exclusively on the plate heat exchanger, note that hygiene throughout a production process cannot be simplified. A risk-based approach to the entire integrated production line is necessary. At the time of writing, samples are being taken for case study 2, in which six objects have been selected for testing. The results from case study 1 were used to assess which known microbiological analytical methods can be used to verify the new measurement methods. Thus, the known microbiological analyses for case study 2 have been carefully selected based on the experience gained from case study 1.
All in all, quick and safe validation of the production equipment cleaning procedures will allow food manufacturers to be certain that they are starting production runs on clean equipment. After control charts have been produced for individual cleaning procedures on a variety of equipment, the charts will serve as a useful resource for optimising cleaning.

Annette Baltzer Larsen
Related material
Professional network for food contact materials
/Club
In the network we meet to share knowledge about topics related to food contact materials.
Centre for Hygienic Design
/Facility
Hygienic design and product safety for the food, biotechnology, and pharmaceutical industries.
New competency centre supports green transition
/Project
The centre will benefit the life science, biotech, and food industries.
Hygienic design is important in new production equipment
/Article
When planning or optimising food and pharmaceutical production facilities, hygienic design is a must.